
ProNeta Electech - Analysis
1. Assembly Maps
Detailed map of the assembly constituency with Village Boundaries laid over Google Map imagery (Road or Satellite)
This map is shared as a PDF which you can print on large paper (A1/A2 size) and use for campaign planning. Download PDF
On Request we can create web links where you can see it on Google map and zoom. Visit Page
As required, Additional info like Booth count, voters count, population, Village subgroup etc. can be shown over the map for better understanding.
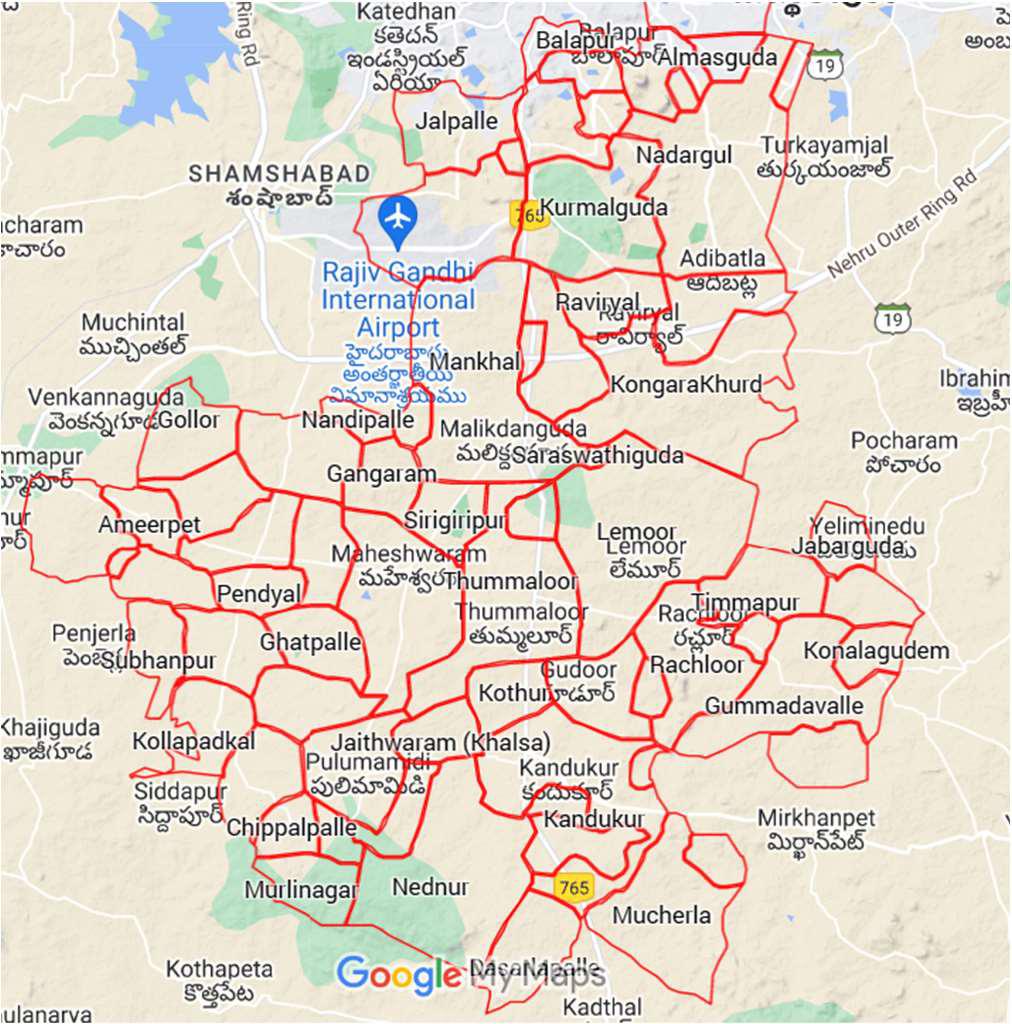
*Shapefile or geojson of assembly also available on request.
2.Previous Results Analysis
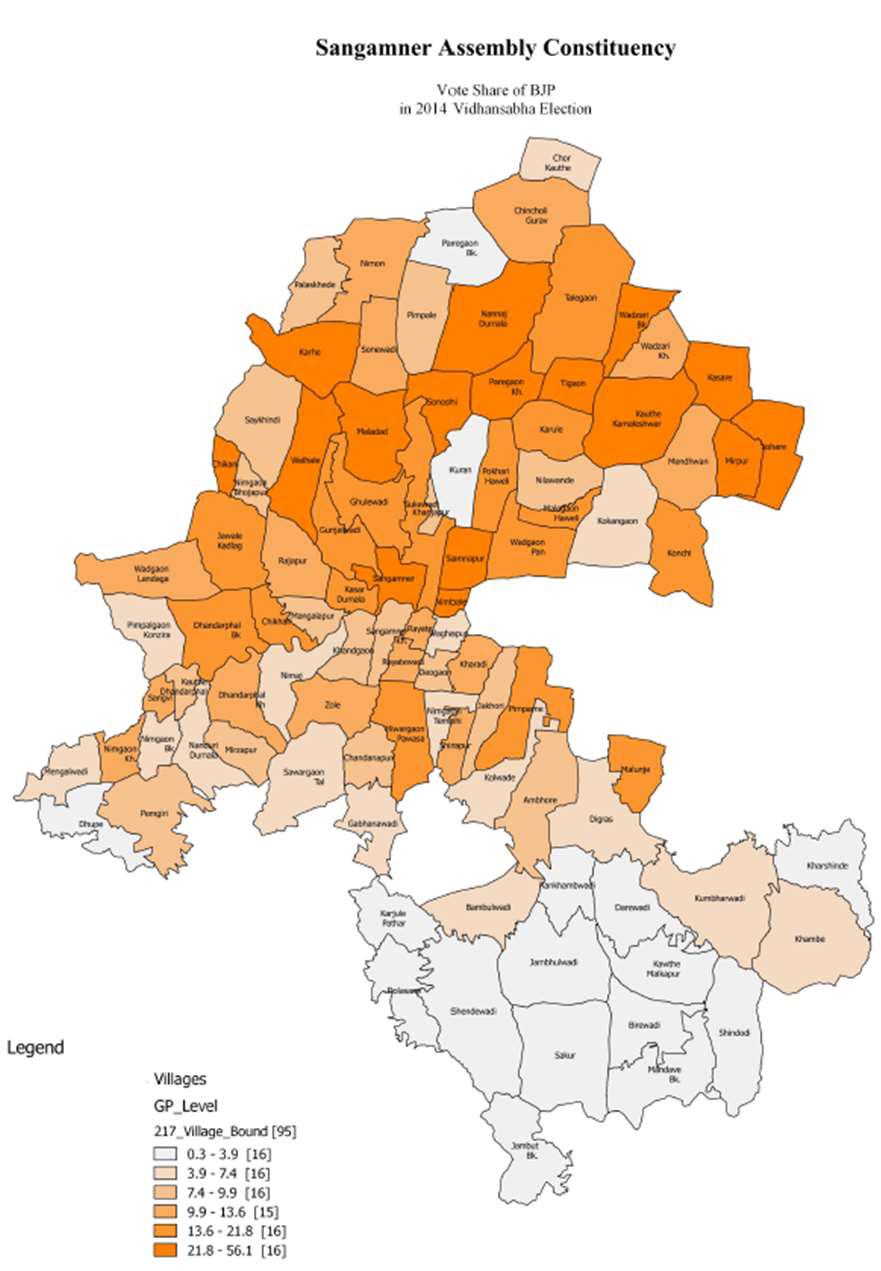
Analysis of village level vote share based on previous elections results and booth list. (Form- 20 analysis)
Grouping of villages into Strong-Medium-weak for a party or Falling-Rising vote share.
Presented in a PDF Map of assembly and a table or an Interactive Dashboard.
This report should create the basis for survey done on the ground. You may vary some questions asked as per villages.
Analysis like effect of coallitions, defections etc. can be done as applicable.
3.Voter List Analysis
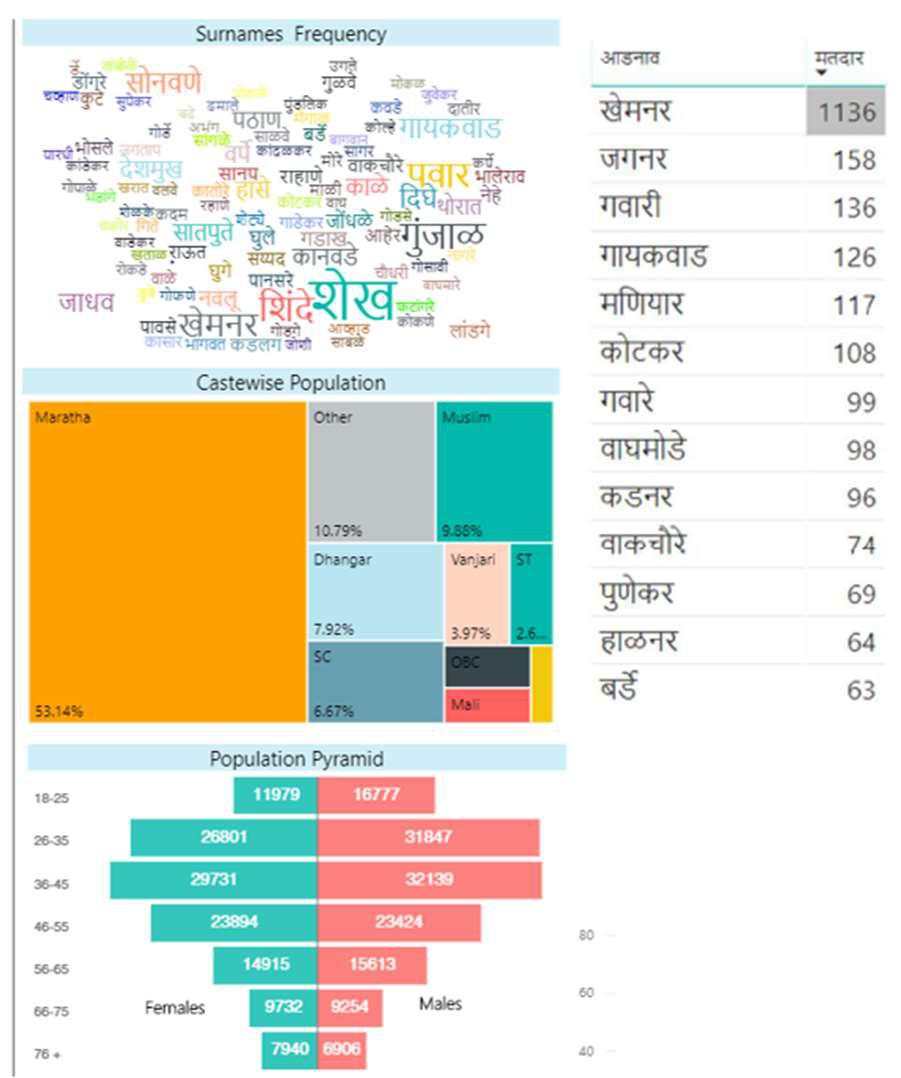
Analysis of Assembly voter lists at Booths and Village level.
Village/Booth wise most common surnames, Age-Gender Breakups to provide demographic divisions.
If a surname to community mapping is feasible, it will be done. This gives approximate but useful results. Analysis of clustering of certain community in some areas, backlogs in youth registration etc. can be done through this analysis.
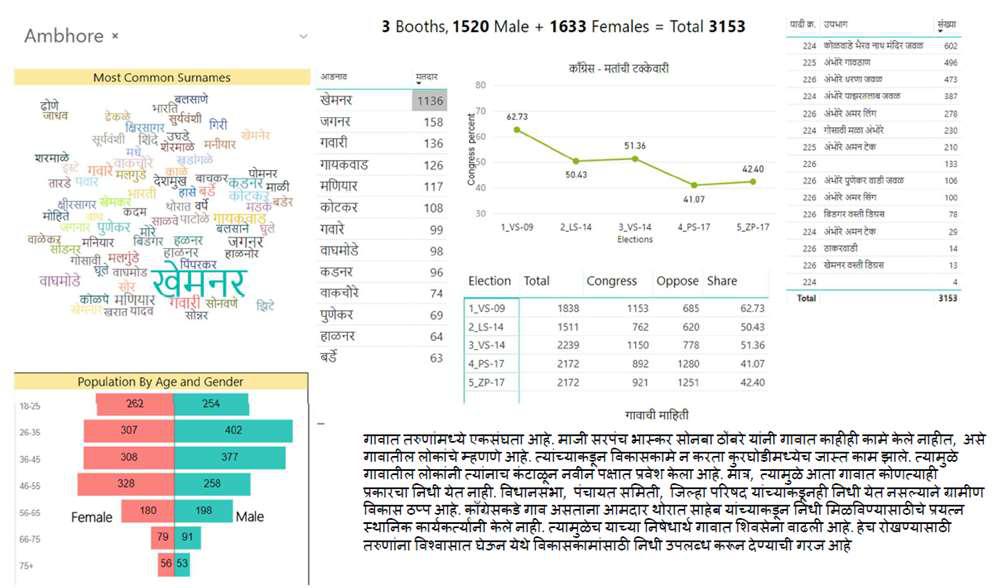
Interactive dashboards combine map(1), Prev. Results(2) and voter list analysis(3) together to create single page reports for each village.
4.Survey Analysis Service
We provide survey data visualization services for surveys done by your agencies.
Our Interactive dashboards can display survey results in much more useful way. With charts, filters etc.
Survey results at village level can be combined with Maps and Prev. results to bring out causes of high/low vote share.
Single page village reports and maps can be made for custom analysis.